Consolidated Performance Highlights
Consolidated Performance Highlights
- Revenue
- Gross profit
- Operating profit
- Non-GAAP
operating profit - Profit attributable to owners of parent
- 【Reference】
Net sales
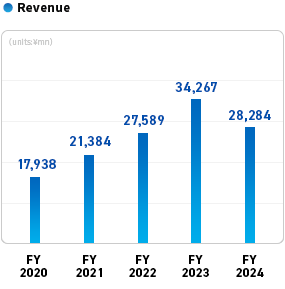
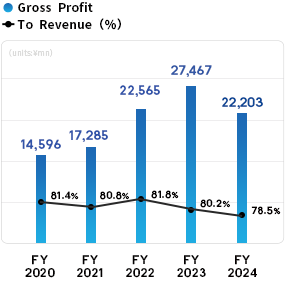
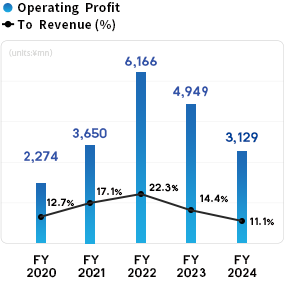
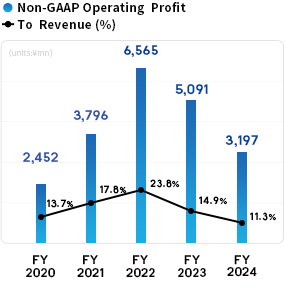
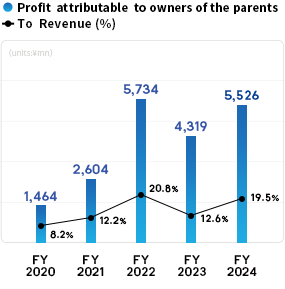
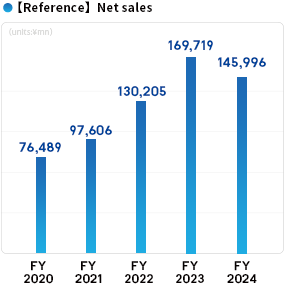
| FY2021 | FY2022 | FY2023 | FY2024 | FY2025 | |
|---|---|---|---|---|---|
| Revenue | 21,384 | 27,589 | 34,267 | 28,284 | 30,309 |
| Gross profit | 17,285 | 22,565 | 27,467 | 22,203 | 23,164 |
| Operating profit | 3,650 | 6,166 | 4,949 | 3,129 | 4,239 |
| Non-GAAP operating profit | 3,796 | 6,565 | 5,091 | 3,197 | 4,414 |
| Profit attributable to owners of the parent |
2,604 | 5,734 | 4,319 | 5,526 | 3,491 |
| 【Reference】Net sales | 97,606 | 130,205 | 169,719 | 145,996 | 148,783 |
*1 FY2023 is 15 months from October 1, 2022 to December 31, 2023 due to a change in the fiscal year-end.
*2 Revenue, gross profit, operating profit, Non-GAAP operating profit, and net sales for FY2022 and FY2023 are presented based on the amounts after the reclassification of the performance of COMISMA INC. (formerly COMICSMART INC.) and its subsidiaries, etc., as discontinued operations.
- Revenue
- Gross profit
- Operating profit
- Non-GAAP
operating profit - Profit attributable to
owners of the parent - 【Reference】
Net sales
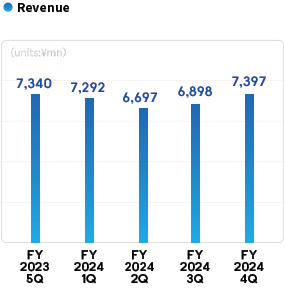
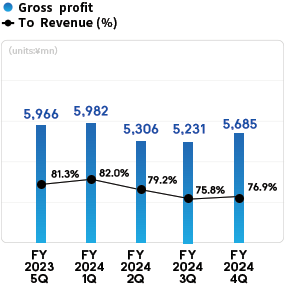
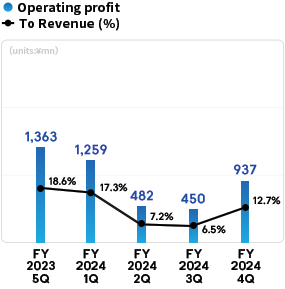
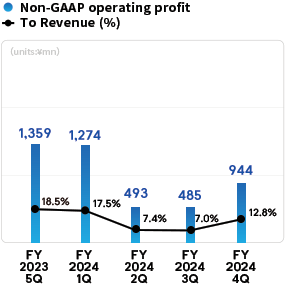
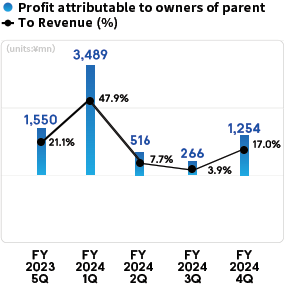
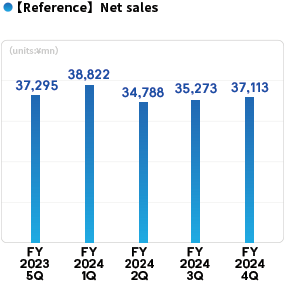
| FY2024/4Q | FY2025/1Q | FY2025/2Q | FY2025/3Q | FY2025/4Q | |
|---|---|---|---|---|---|
| Revenue | 7,397 | 8,206 | 7,001 | 7,081 | 8,020 |
| Gross profit | 5,685 | 6,364 | 5,186 | 5,421 | 6,194 |
| Operating profit | 937 | 1,557 | 467 | 785 | 1,429 |
| Non-GAAP operating profit | 944 | 1,571 | 494 | 797 | 1,553 |
| Profit attributable to owners of parent | 1,254 | 1,524 | 332 | 634 | 1,001 |
| [Reference] Net sales | 37,113 | 41,863 | 33,526 | 34,236 | 39,158 |
Financial Highlights
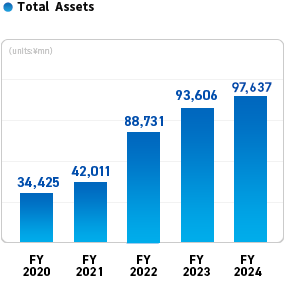
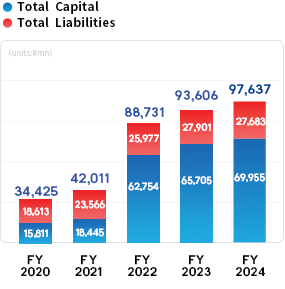
| FY2021 | FY2022 | FY2023 | FY2024 | FY2025 | |
|---|---|---|---|---|---|
| Total assets | 42,011 | 88,731 | 93,606 | 97,637 | 96,345 |
| Total equity | 18,445 | 62,754 | 65,705 | 69,955 | 66,584 |
| Total liabilities | 23,566 | 25,977 | 27,901 | 27,683 | 29,761 |
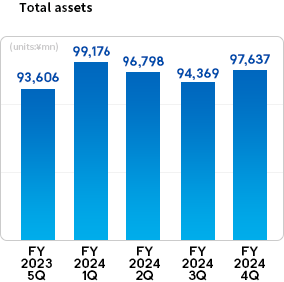
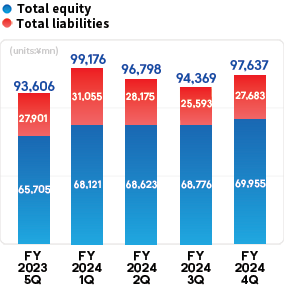
| FY2024/4Q | FY2025/1Q | FY2025/2Q | FY2025/3Q | FY2025/4Q | |
|---|---|---|---|---|---|
| Total assets | 97,637 | 101,811 | 89,985 | 90,548 | 96,345 |
| Total equity | 69,955 | 64,906 | 65,006 | 65,626 | 66,584 |
| Total liabilities | 27,683 | 36,905 | 24,979 | 24,922 | 29,761 |
Cash Flows
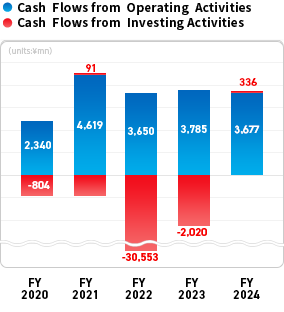
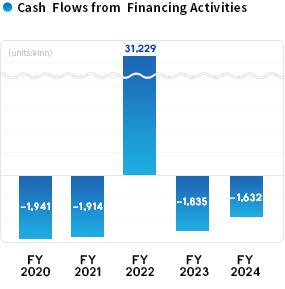
| FY2021 | FY2022 | FY2023 | FY2024 | FY2025 | |
|---|---|---|---|---|---|
| Cash flows from operating activities | 4,619 | 3,650 | 3,785 | 3,677 | 3,374 |
| Cash flows from investing activities | 91 | -30,553 | -2,020 | 336 | -3,099 |
| Cash flows from financing activities | -1,914 | 31,229 | -1,835 | -1,632 | -6,044 |
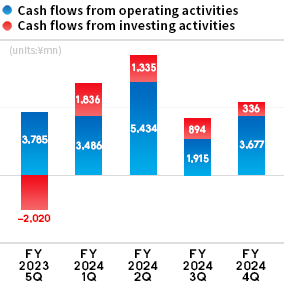
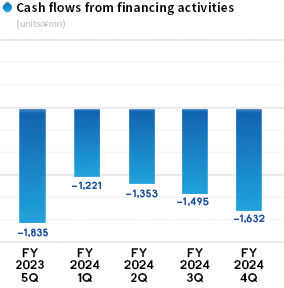
| FY2024/4Q | FY2025/1Q | FY2025/2Q | FY2025/3Q | FY2025/4Q | |
|---|---|---|---|---|---|
| Cash flows from operating activities | 3,677 | 5,899 | 2,499 | 1,817 | 3,374 |
| Cash flows from investing activities | 336 | -847 | -884 | -2,434 | -3,099 |
| Cash flows from financing activities | -1,632 | -5,653 | -5,786 | -5,916 | -6,044 |
* Describe the results during the cumulative period
Various Indicators
| FY2021 | FY2022 | FY2023 | FY2024 | FY2025 | |
|---|---|---|---|---|---|
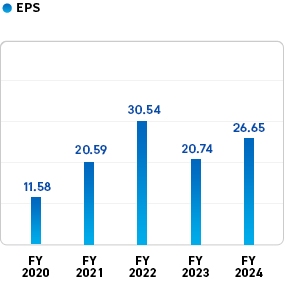
| EPS | 20.59 | 30.54 | 20.74 | 26.65 | 16.83 |
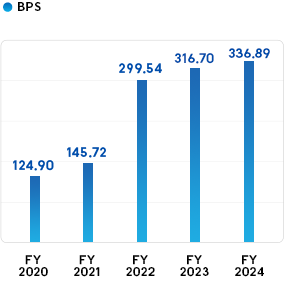
| BPS | 145.72 | 299.54 | 316.70 | 336.89 | 320.83 |
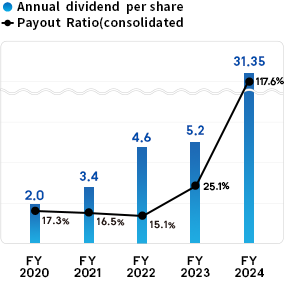
| Annual dividend per share | 3.4 | 4.6 | 5.2 | 31.35 | 18.0 (forecast) |
| Payout ratio(consolidated) | 16.5% | 15.1% | 25.1% | 117.6% | 106.9% |
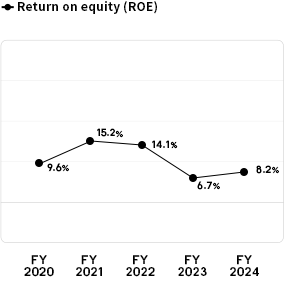
| Return on equity(ROE) | 15.2% | 14.1% | 6.7% | 8.2% | 5.1% |